RE/MAX NATIONAL HOUSING REPORT Q4 2022
Steady But Slow Results for the Local Housing Market
As predicted, the local housing market has started to show signs of entering a cooling-off period following the season of hyperactivity that was caused by record-low interest rates.
According to Lightstone Property data, as at 09 January 2023, the number of transfers (both bonded and unbonded) recorded at the Deeds Office for the period October to December 2022 amounted to 57,053*. When reviewed against the figures from previous RE/MAX National Housing Reports, this amount is down by 6% on last quarter and stagnant YoY.
The same data also reflects that a total of 39,053 bond registrations were recorded at the Deeds Office over the period October to December 2022. The RE/MAX National Housing Reports reveal that this figure is down by 5% on Q4 2021’s figures.
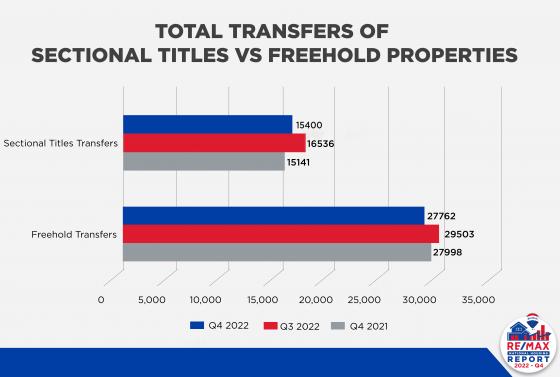
Of the 57,053 transfers, a total of 27,762* freehold properties and 15,400* sectional title units were sold countrywide (these figures exclude estates, farms, and land-only transfers). Reviewed against previous RE/MAX National Housing Reports, the number of freehold properties registered dropped by 6% compared to the results of last quarter and by 1% YoY. Sectional titles, however, increased by 2% YoY but dropped by 7% QoQ.
Regional Director and CEO of RE/MAX of Southern Africa, Adrian Goslett explains that this decrease in number of transfers can be expected following the series of interest rate hikes that occurred last year. “It is natural to expect the market to slow down when interest rates climb. Sellers can expect less demand in 2023 as a result of the rising interest rates,” he comments.

Activity shifts back to lower price brackets
After having accounted for a slightly larger slice of the pie in the third quarter of 2022, transfers priced above R5 million now account for 7,5% of all transfers (down from 8,1% in Q3). Taking up a bigger portion of all transfers were those between R400,000 – R800,000, moving from 21,8% in Q3 to 23,5% in Q4.
Remaining much the same as previous quarters, transfers below R400,000 accounted for 22.4%. Those between R800,000 – R1,5 million accounted for 26,6% and those between R1,5 million to R3 million accounted for 20%.
“Luxury buyers tend to become more reluctant to make big investments within times of economic uncertainty. My prediction is that activity is therefore likely to remain slow within the luxury housing market going forward. However, rising interest rates also tend to hit the lower income brackets the hardest, which could lead to fewer sales within these price brackets too,” Goslett comments.
Average house prices hold
Lightstone Property reported in the House Price Index as of end November 2022 that national year-on-year house price inflation is at 2.69%, having decreased consistently since early 2021.
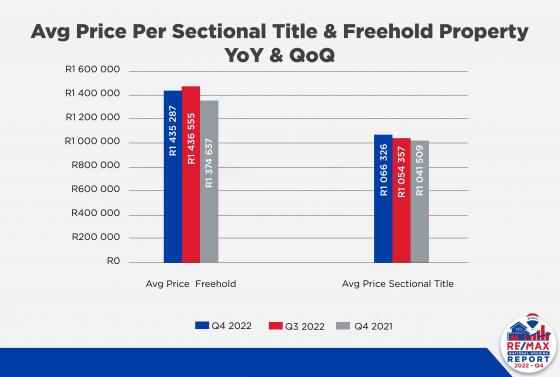
According to Lightstone Property data retrieved on 09 January 2023, the nationwide average price of sectional titles is R1,066,326*. When reviewed against the figures from previous RE/MAX National Housing Reports, this amount reflects 2% growth compared to the same period last year and 1% growth compared to last quarter.

Based on the same data, the nationwide average price of freehold homes is R1,435,287*. When reviewed against the figures from previous RE/MAX National Housing Reports, this amount increased by 4% YoY and was stagnate compared to last quarter. The Average Active RE/MAX Listing Price for the third quarter bounced back after having dipped slightly last quarter and amounted to R3,527,199.
“Unless the current economic outlook changes, average house prices are likely to remain somewhat stagnant in the year ahead. However, each suburb will have its own unique trends and prices will vary depending on demand. It would be a good idea to keep in touch with your local RE/MAX agent to find out how your suburb specifically is performing,” Goslett recommends.
Western Cape continues to thrive
The Western Cape continues to attract buyers above all other provinces. All the top five searched suburbs on remax.co.za are once again found in this region:
- Parklands, Western Cape – 2674 searches
- Bloubergstrand, Western Cape – 2638 searches
- Sunningdale, Western Cape – 2479 searches
- Claremont, Western Cape – 2414 searches
- Sea Point, Western Cape – 2197 searches
The Western Cape also continues to be the most expensive province. According to Private Property, the median asking price per province of active listed stock on Private Property for Q4 2022 were as follows:

** Disclaimer: The data reflected herein represents data that is voluntarily obtained from subscribers from the Private Property South Africa’s website and is based solely on data collected by Private Property South Africa (Pty) Ltd. Further, the data reflected herein is accurate as per the Private Property South Africa database dated 12 January 2023. Reliance on such data is at the sole discretion of subscribers and Private Property South Africa hereby indemnifies itself of any consequence of such reliance.
Final thoughts
“After reviewing the results from Q4, I stand by my previous predictions that the year ahead might be a tough one, especially within the real estate industry. There are likely to be fewer transactions this year and house prices are unlikely to show high levels of growth. However, the need to buy and sell property will exist within any economic climate. Sellers should have no problem securing full asking price in the year ahead if the home is priced fairly and marketed by a trusted real estate professional.” Goslett concludes.
*Figures according to Lightstone Property. Data captured on 09 January 2023
Issued by RE/MAX of Southern Africa
Send to a Friend